
Does genetic evidence really increase drug success by 2-3×?
A deep dive into one of the biotech's most influential papers

Modern drug development is frustratingly inefficient. Less than 10% of drugs entering clinical trials ultimately reach approval. The median R&D cost for bringing a drug to market is estimated to exceed $1 billion, and development typically takes more than 10 years. There is little evidence that the process is improving. If anything, success rates may have declined in the 21st century. The main reasons drugs fail are lack of efficacy (ca. 40-60% cases) and unexpected safety issues (ca. 20-30%). Through basic science, we are very productive at generating hypotheses for new drug candidates. However, we remain very, very, very poor at predicting which of these candidates will survive the bottleneck of clinical development.

Human genetics is increasingly recognized as a powerful approach for identifying therapeutic hypotheses that are more likely to translate into successful drugs. If naturally occurring genetic variants that alter the function or expression of a potential drug target also influence the risk of a disease, they provide causal human evidence that modulating this target could affect disease pathogenesis. In this sense, we can study the ‘experiments’ that nature has already performed by perturbing biological pathways through genetic variation. Observing how these perturbations influence disease risk can provide a causal signal that helps de-risk subsequent drug development.
There are now several examples of genetics-guided drug development. Perhaps the best-known one is PCSK9: rare mutations associated with extremely low LDL cholesterol were found to dramatically reduce the risk of coronary artery disease, motivating the development of PCSK9 inhibitors that are now approved therapies. Another emerging example is F11 (factor XI): individuals with genetic deficiency of this coagulation factor were long known to have a lower risk of thrombotic events without an increased risk of bleeding. Genetic studies, including Mendelian randomization analyses, further supported this observation by showing that F11 variants that lower factor XI levels are associated with reduced risk of ischemic stroke without increasing risk of intracerebral hemorrhage. This hypothesis also recently received clinical validation. Phase III results for asundexian, a small-molecule factor XI inhibitor, showed a reduction in recurrent stroke without an increase in major or intracranial bleeding among patients with non-cardioembolic ischemic stroke.
This is a very appealing idea, especially in the modern era of large-scale genomic datasets. We now have access to population-scale data that capture genetic variation across most genes in the human genome, as well as studies linking this variation to risk of thousands of diseases. But can we generalize the concept across the drug development landscape? Does evidence of genetic support for the target of a drug improve its chances of making it through the development pipeline?
Human genetic support and drug success rates
A study published in 2024 in Nature tried to answer exactly this question. The paper has been cited almost 300 times as of March 2026, but has likely appeared even more often in biotech pitch decks by aspiring founders. An earlier version of this analysis was published in 2015 in Nature Genetics with largely the same conclusions and has accumulated >1700 citations. The core message of both analyses is the same: drugs targeting mechanisms with human genetic support are 2 to 3 times more likely to reach approval.
Considering the inefficiency of the status quo, this is massive improvement. The biggest bottleneck in drug development is not the generation of new ideas (as often implied), but the generation of ideas that survive the bottleneck of clinical trials. If the claim of this paper is true, the napkin math is compelling: prioritizing 10 programs without considering genetic support might yield at best one approved drug that must pay for the other nine failures. Prioritizing programs with genetic support, in contrast, could produce two or even three approvals, dramatically changing the economics of drug development.
To date, this remains the only target-level prioritization strategy backed by empirical data that appears to meaningfully influence the probability of a drug reaching approval. Thus, it is unsurprising that this analysis has become so widely influential.
I have cited this paper myself several times (e.g. here, here, and here), and I have also used it in presentations to make the argument about the value of human genetics. But I have always found the most widely cited takeaway ("that genetic support increases chances of approval by 2-3 times”) somewhat reductionist. “Genetic support” can take many forms, and the strength of evidence varies enormously across different approaches used to link genetic variant to disease. While this nuance is well understood by researchers working in human genetics, it is often lost outside the field. So, in this post, I decided to take a closer look at what has arguably become one of the most influential claims in modern drug development.
The paper: defining the drug development space
At a high level, the authors used a historic dataset of drug development with all target-indication (T-I) pairs ever pursued, and then checked which of them are backed by genetic support. They then produced estimates of success rates for T-I pairs with vs. without genetic support. Sounds straightforward. Let’s take a closer look at the study design step-by-step.
The authors started with using a curated commercial database of the current drug development landscape, Citeline Pharmaprojects, which attempts to catalog all drug development efforts —from preclinical stages through clinical phases to launched (approved) drugs. The first step is translating drugs to targets, which is the level at which genetic support is defined. While most modern drugs are indeed developed with a target in mind, determining targets for many drugs, especially older ones, is far from trivial. For example, even well-studied drugs such as metformin or colchicine can have complex target profiles. The methodology for this assignment is not described in detail in the paper, but the authors partly control for this by restricting their analyses to drugs with a single target in a sensitivity analysis, which produced results similar to the main analysis.
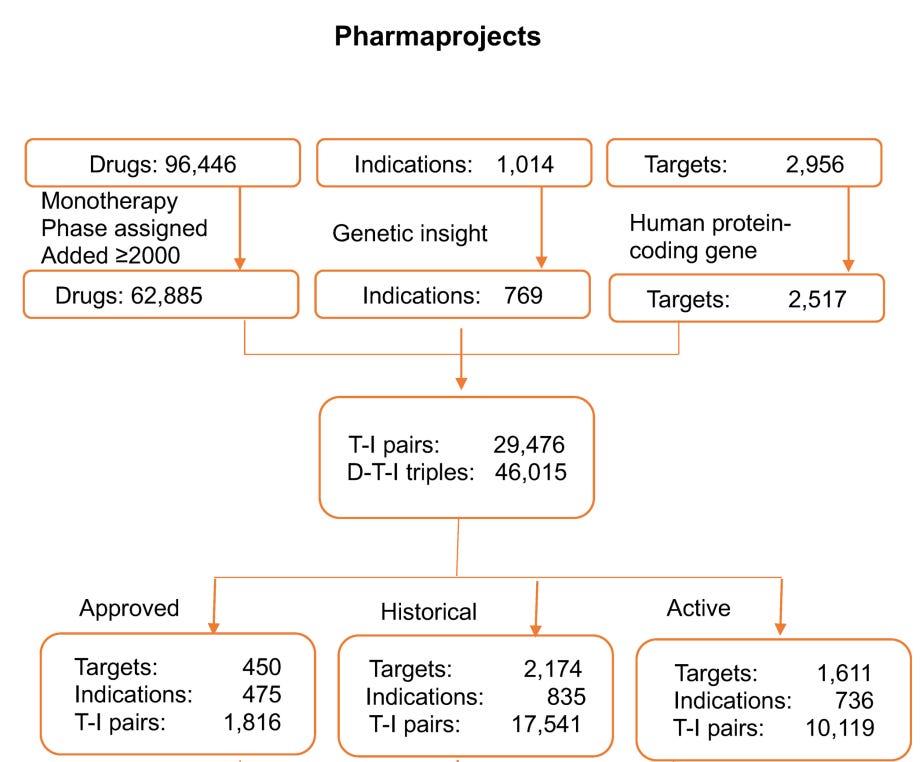
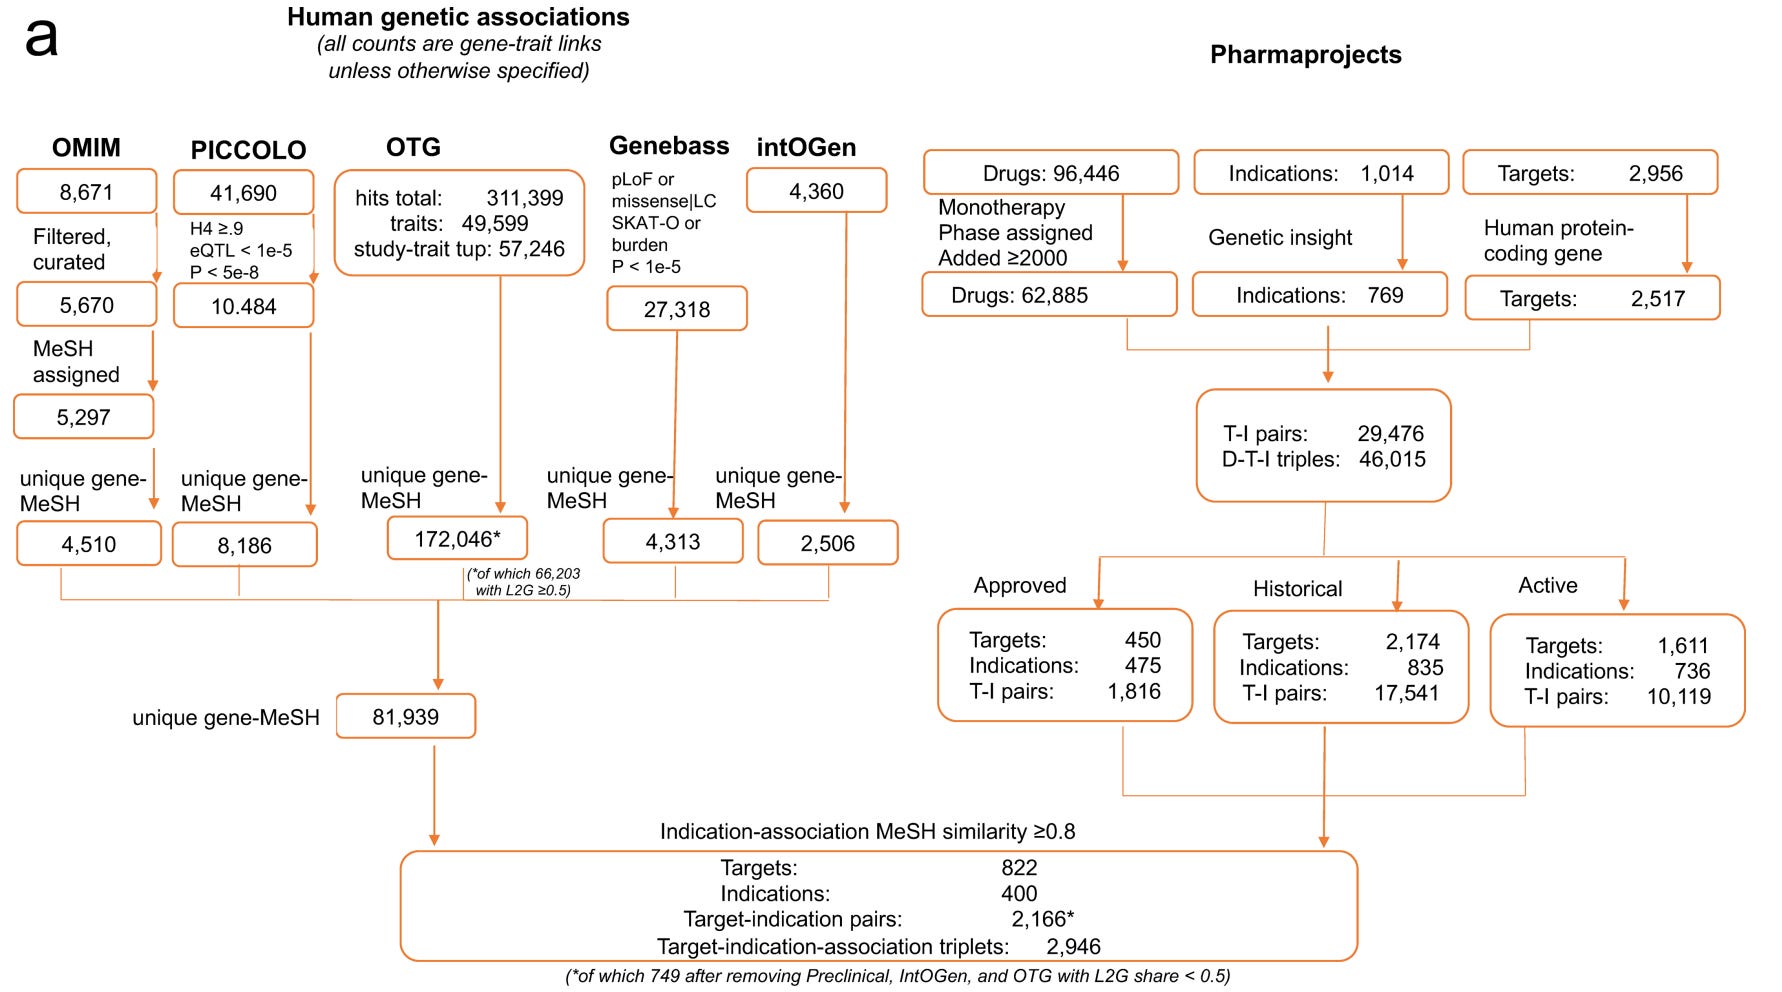
How did the authors exactly filter T-I pairs? They focused on 62,885 monotherapy programmes tested after 2000, corresponding to 2,517 targets across 769 tested indications. This resulted in 29,476 unique T-I pairs or 46,015 drug-target-indication triplets. The T-I pairs were further classified into approved programmes (1,816 pairs), historic programmes that had been concluded (17,541 pairs), and active programmes still in development(10,119 pairs).
The approach sounds reasonable and is probably as close as one can get to a comprehensive dataset of the entire modern biotech and pharma industry. That said, while Citeline is broad and widely used in both industry and academic analyses of drug pipelines, it shares the typical limitations of large aggregated databases. Important details, such as indication definitions or accuracy of development stage are quite coarse.
Table S1 provides a list of the T-I pairs examined (25,713 entries vs. 29,476 reported; the reason for the discrepancy is unclear) and, to the authors’ credit, a complete dataset of the presented analyses that allows reproducibility checks. However, even a quick scan of familiar T-I pairs makes the coarseness of the dataset apparent.
Some examples:
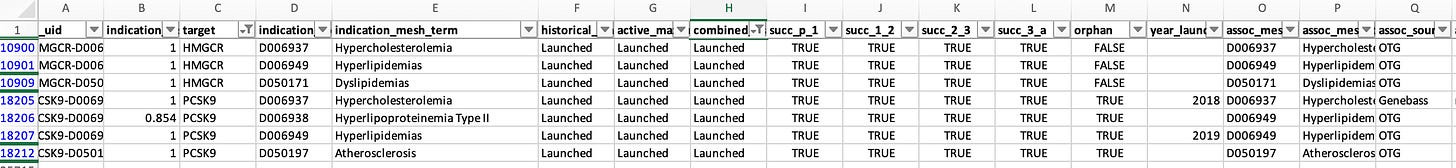
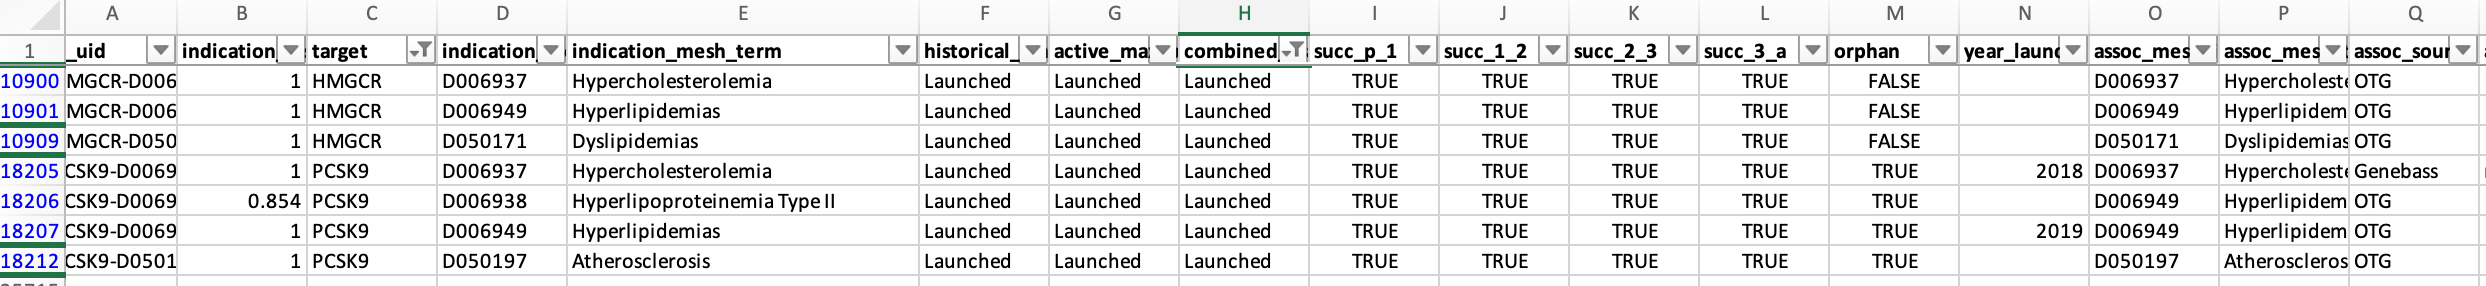
HMGCR, the gene coding for the target of statins, is listed as launched for 3 indications: hypercholesterolemia, dyslipidemias, and hyperlipidemias. The same applied for PCSK9, which is listed as launched for hypercholesterolemia and hyperlipidemias. All of these pairs are classified as genetically supported. These indications are, of course, very closely related (in essence duplicate entries), so counting them multiple times can influence the results.
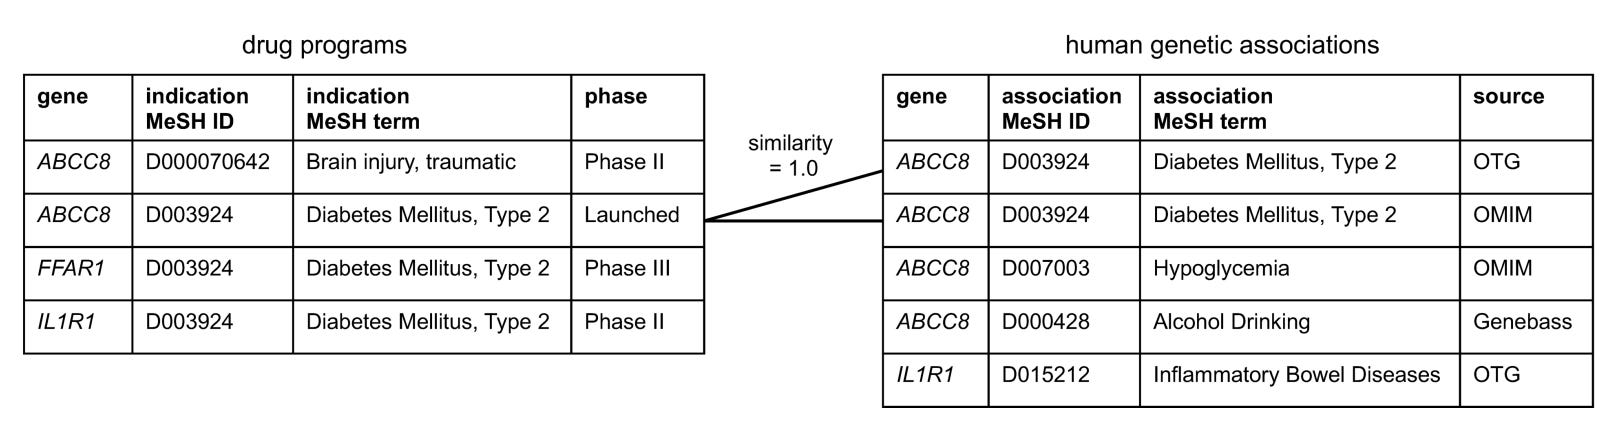
This pattern of duplicate entries is seen across many approved drugs or drugs in advanced development. For example, ABCC8, the target of sulfonylureas, is marked as launched for both “Diabetes Mellitus” and “Diabetes Mellitus, type 2.” The same target is listed at Phase III for both “Stroke” and “Brain Ischemia”.

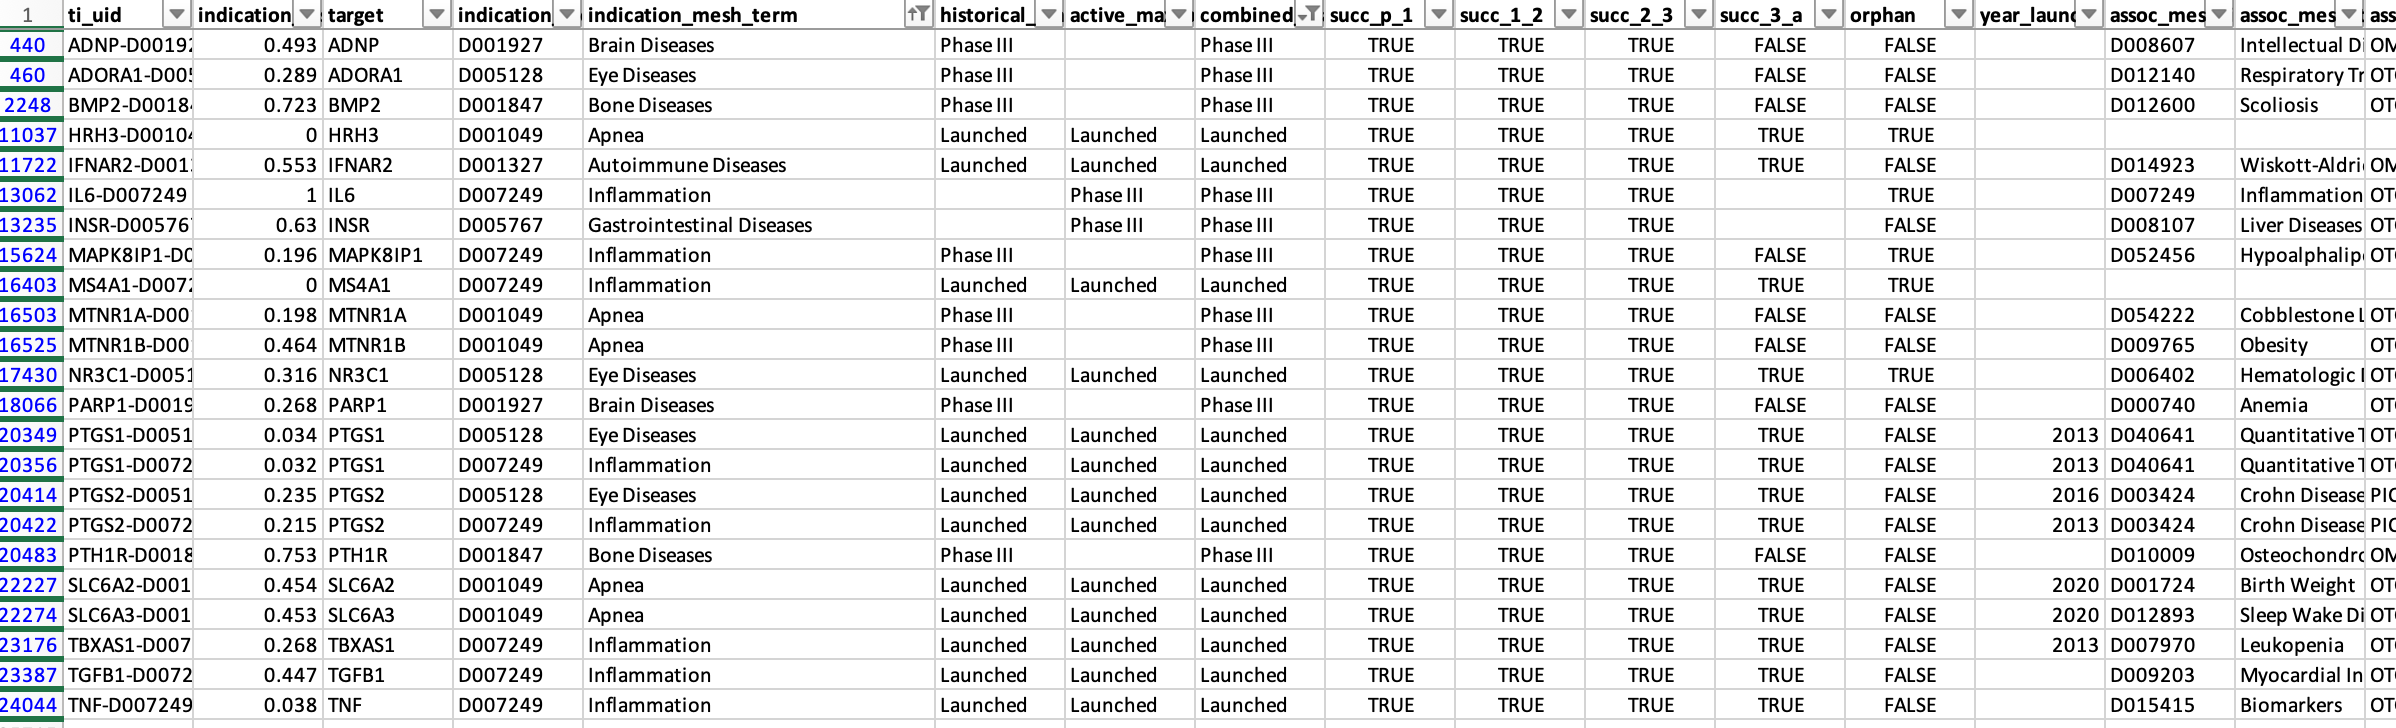
Some indications are simply too broad to be realistic. Examples among launched programs or Phase III studies include “Brain diseases,” “Apnea,” “Bone diseases,” “Autoimmune diseases,” “Eye diseases,” “Gastrointestinal diseases,” and “Inflammation.” As I’ll discuss later, searching for genetic support for such broad indications is inherently challenging.

There are also clear labeling errors. For instance, EDNRB is listed as approved for stroke, although I am not aware of any such drug. Conversely, ACLY, the target of bempedoic acid, is marked as being in preclinical studies, despite it being FDA-approved since 2020.
Genetic evidence space
In parallel to assembling the drug development dataset, the authors constructed a database of genetic evidence. They considered an indication to possess “genetic insight” (i.e. the genetic architecture of this trait or similar traits had been successfully studied), if it showed ≥0.8 similarity to (1) an OMIM or IntOGen disease, or (2) a GWAS trait with at least three independently associated genomic loci. I assume that this step explains why the analysis moves from 29,476 T–I pairs to the 25,713 entries included in the supplementary database, although this is not clarified.
How do the authors define genetic support for these T-I pairs?
I would assume that the straightforward approach would be to take the 25,713 T–I pairs and determine whether each has genetic support or not. Instead, the authors first compiled all available genetic datasets identifying more than 180,000 significant gene–trait associations, independently of the drug development dataset. They then linked each trait studied in the genetic evidence space to a MeSH term, ultimately generating 81,939 gene–indication pairs. Only at that stage did they attempt to map these associations to the 25,713 T–I pairs derived from the drug development space.
At first glance this feels like a substantial detour, but one could argue that it represents a parallel effort independent of the drug development dataset, potentially increasing objectivity. A key challenge, however, is that the terminology used in the Citeline database for indications (with all the issues described earlier) must be matched to traits studied in genetic analyses. This is far from trivial. Genetic studies are rarely designed with drug development pipelines in mind; their primary goal is usually to discover new biology.
The authors therefore implemented a two-step mapping procedure. First, each genetic trait was linked to a MeSH term. Second, the MeSH term assigned to the Citeline indication was compared with the MeSH term derived from the genetic trait. To link the two, they used a semantic similarity score based on etymological and disease-area similarity that ranges from 0 (no similarity) to 1 (identical). The exact methodology for calculating this score is described in the paper. I did not attempt to dissect it in detail, as this lies entirely outside my comfort zone. The authors used a similarity threshold of 0.8 to define a match between a genetic trait and an indication for a target. Each T-I pair was linked to the genetic MeSH term achieving the highest similarity for that target. Using this threshold, 1,255 T–I pairs were classified as having genetic support. Again, to the authors’ credit, all intermediate mappings and similarity scores are transparently provided in the supplementary dataset for each T–I pair.
However, again the algorithm often produces questionable mappings.
First, some issues arise already when genetic traits are mapped to MeSH terms. For example, cortical thickness, a continuous MRI trait studied in the general population, is mapped to the MeSH term cobblestone lissencephaly, a rare congenital malformation characterized by severe cortical abnormalities. Similarly, sleep duration in the general population maps to sleep–wake disorders, and fibrinogen levels map to chronic obstructive pulmonary disease.
Second, the linkage between genetic traits and drug indications based on a similarity threshold of 0.8 produces many counterintuitive results. For example:
Acute coronary syndrome and myocardial infarction have a similarity score of 0.733, meaning that genetic evidence for one is not counted as support for the other.
Brain ischemia and stroke have a similarity score of 0.755, again falling below the threshold.
You could think that this is because the algorithm is too strict and only matches really synonymous terms. But several disease pairs with similarity scores above 0.8, therefore treated as sufficiently similar, simply don’t make sense. For example:
melanoma and pheochromocytoma (0.805)
sepsis and inflammation (the MeSH term linked to the genetic analysis of CRP levels) (0.803)
medulloblastoma and glioma (0.843)
esophageal neoplasms and thyroid neoplasms (0.805)
When combined with the labeling issues discussed earlier, this leads to some obvious misclassifications. For example, one of the indications tested for PCSK9 in the dataset is acute coronary syndrome. Among the genetic associations for PCSK9, the closest mapped trait is myocardial ischemia (the MeSH term assigned to the GWAS trait ischemic heart disease), with a similarity score of 0.733. Because this falls below the 0.8 threshold, the T–I pair is classified as not genetically supported. In reality, as mentioned earlier, PCSK9 is arguably one of the clearest examples of a genetic discovery successfully translated into drug development. An association with coronary disease would be extremely strong in essentially any genetic dataset available today.
Definition of genetic support
Let’s now focus on the core element of the analysis. What is that that makes a target genetically supported? The study defines “genetic support” using five different data sources. I will focus primarily on the Open Targets Genetics (OTG) database, which is based on GWAS findings linking common variants to disease traits. OTG was by far the largest contributor to T-I links with genetic support (≈80% of the total 81,939).
OTG compiles GWAS hits and attempts to assign each locus to a causal gene using a machine-learning model called L2G. L2G predicts the most likely causal gene at a locus using several features, including distance to the lead variant, functional annotations, expression quantitative trait loci (eQTLs), and chromatin interaction data. The model was developed by the Open Targets team, and each gene at a significant GWAS locus is assigned a probability that it drives the observed association.

L2G is an elegant model that was trained on 445 “gold standard” causal genes derived from fine mapping, colocalization, functional genomics, and positional information. It represents an effort to tackle one of the central problems in human genetics: identifying the causal gene driving significant associations in GWAS loci. However, as usual, the devil is in the details. In the original paper describing the method, an L2G score >0.5 (also used in this study) correctly identified only 238 of the 445 true causal genes, while producing 86 false positives. In other words, the predictions are far from perfect. For comparison, a much simpler model that simply assigns the gene closest to the lead GWAS variant correctly identified 268 of the 445 causal genes.
This highlights a broader issue with many automated gene-mapping models. They often look excellent as publications, but lack the level of granularity needed for drug discovery, where enormous resources are invested in a single target and the level of confidence that it is causally related to the disease of interest needs to be very high.
But it also reflects a core limitation of modern genomic research: we still lack methods to reliably match GWAS signals to causal genes at scale. In practice, a careful manual analysis often performs better. A researcher systematically going through significant GWAS loci by combining literature review, molecular QTL datasets, colocalization analyses, Mendelian randomization, and experimental data, will most likely reach a more accurate conclusion than current automated approaches. If I had to bet whether a PhD student or the L2G algorithm would better identify causal genes from a new GWAS we ran, I would always place my money on the PhD student.
Beyond OTG, the authors used PICCOLO, a method linking GWAS signals to expression quantitative trait loci through colocalization. PICCOLO was introduced in a 2019 preprint (still unpublished) led by the senior author of the present study. Unlike standard colocalization approaches that rely on full summary statistics, PICCOLO uses minimum SNP p-values within a locus to infer shared signals. Colocalization methods are extremely powerful and widely used to integrate GWAS with molecular traits, but they do not on their own prove causality. PICCOLO contributed 8,186 associations (~10%), making it the second-largest GWAS-derived source after L2G.
The authors also incorporated four additional sources of genetic evidence. OMIM is a curated database of Mendelian gene–disease associations, capturing monogenic causes of disease. After filtering for clearly causal relationships, the authors identified 4,510 gene–trait associations that could be mapped to unique MeSH terms. Rare mutations in a single gene causing a disease phenotype, often with experimental support, represent some of the strongest genetic evidence available. For oncology indications, the authors used IntOGen, a database that identifies genes enriched for somatic mutations across cancer types. OMIM contributed 4,510 associations (~5%), while IntOGen contributed 2,506 (2-3%) of the genetically supported T-I pairs.
Finally, the analysis also included Genebass, a resource based on gene-burden tests from whole-exome sequencing data in the UK Biobank. These analyses collapse multiple predicted loss-of-function or damaging variants within a gene and test their association with traits. Such signals can provide strong evidence for gene involvement, but they often suffer from limited statistical power, since truly disruptive variants are rare. As a result, Genebass contributed 4,313 T-I associations (~5%).
Overall, this framework inevitably introduces a fair amount of imprecision. Beyond OMIM and Genebass, which together contribute roughly 10% of all genetically supported associations and arguably represent the strongest evidence, OTG and PICCOLO likely produce many false positive and false negative results. Of course, when working at the scale of tens of thousands of T-I pairs, some level of approximation is unavoidable, but the higher the imprecision, the less confident we can be at the main result.
Another important limitation is that the framework does not account for directionality of effect. Genetic variants that increase disease risk through loss-of-function mechanisms imply very different therapeutic strategies than variants acting through gain-of-function effects. In drug development, these differences determine whether a target should be inhibited or activated. This distinction was not incorporated in the analysis. As a result, some associations involving loss-of-function variants could theoretically motivate agonist therapies, meaning that the genetic evidence actually argues against the direction of the drug being developed. Nevertheless, such T-I pairs are still classified as having genetic support.
Analyses and key results
With this dataset finally assembled, the analyses were relatively straightforward. The authors compared success rates at each stage of development between genetically supported and unsupported T—I pairs, computing relative success (RS) rates.
The headline result was an RS of 2.6 (95% CI: 2.3–3.0) from phase I to launch. The effect varied by therapeutic area, ranging from >3.5 for hematology and metabolic diseases to non-significant differences (confidence intervals including 1) for dermatology, ophthalmology, and musculoskeletal diseases.
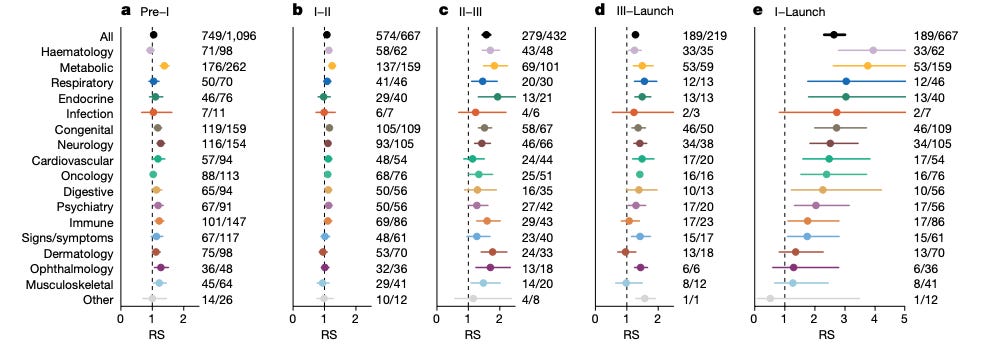
Beyond these widely cited numbers, the paper reports several additional observations that are of interest. The impact of genetic support was strongest in later development stages—particularly phase II→III and phase III→launch—and weaker in earlier transitions. The authors did not observe an effect of genetic effect size or year of discovery on success rates. They also reported an inverse relationship between the number of indications pursued per target and RS, interpreting this as reflecting a stronger effect for disease-modifying therapies (more likely to be used for unique indications) than for symptom-managing ones (more likely to be used for symptom management across indications).
Another notable observation is how rarely genetically supported targets are actually pursued. At the time of analysis (end of 2022), only 1.1% of all possible genetically supported T–I pairs were being explored in clinical programs. Among phase II and III programs, the proportion was 4.8% for active programs versus 4.2% for historical ones, suggesting little change in this trend over time. These findings are clearly interesting and potentially important for drug development.
Take-home messages
So where does this leave the headline claim that genetic support increases the probability of drug approval by two- to three-fold?
The dataset underlying this analysis is far from perfect. It contains duplicate entries, inaccurate development-stage information for multiple targets, misassigned or overly broad indications, misaligned mappings of genetic traits to disease, and imprecise, heterogeneous evidence for genetic support. Anyone familiar with even a few T-I pairs will quickly notice these imperfections. In this regard, it is hard to trust the accuracy of an estimate derived from such a dataset.
On the other hand, one could argue that despite all this noise, there is still a signal suggesting that human genetic support improves success rates. At the end of the day, the goal of the paper was to provide a big picture estimate across the drug development landscape. This is the best dataset one could realistically assemble and, in this regard, the paper has been highly successful. It has raised awareness in the drug development community, particularly among those with little exposure to human genetics, about the value of integrating genomic insights into decisions on which candidates to advance. Today far more people are interested in human genetics than 10 years ago, which improves investment in the field leading to better genetic datasets and better methods for applying human genetic analyses to drug development.
But this is largely it. For drug developers or investors evaluating a specific target for a specific indication, this analysis offers limited actionable insight. Each T-I pair is biologically unique, and the complexity cannot be distilled into a spreadsheet that aggregates thousands of targets. If one expects to browse the supplementary tables of this paper and find out promising therapeutic targets to pursue, I’m sorry to disappoint you, but I’m afraid this is not the case.
I also feel uncomfortable with the reductionist treatment of “genetic support” as a binary variable. In reality, the underlying evidence is highly heterogeneous. A target may be supported by rare Mendelian variants, proximity to a strong or weak GWAS signal, eQTL and pQTL colocalizations, Mendelian randomization or a combination of these approaches, each carrying different levels of confidence and relevance for therapeutic interventions. In some cases, multiple genes within the same pathway emerge (for example both a ligand and its receptor), increasing confidence in the biological mechanism. Some genetic findings are followed by experimental validation, providing further mechanistic insight. Molecular QTLs may implicate causality through a tissue that is not the primary site of action of the drug under development. Other loci have complex linkage disequilibrium structures, and some genes simply harbor more natural variation than others. Collapsing this spectrum of evidence into a simple yes/no label inevitably loses important granularity.
Some additional issues might be worth noting. The vast majority of drug development programs are not initiated because they are genetically supported but are later annotated as such. Providing genetic evidence for an already hypothesized target is a very different exercise, and much less complex, than identifying a target de novo based on human genetic data. There may also be some elements of survivorship bias, especially in early-stage development: drugs targeting genetically supported pathways may receive preferential funding, increasing their likelihood of progressing through the pipeline. But this bias is probably less relevant for the dominant GWAS-supported targets, many of which have yet to enter clinical development.
My post is not meant to dampen enthusiasm for the use of human genetic insights in drug development. On the contrary, anyone who has followed my work, knows that I strongly believe that human genetics can reshape the drug development landscape. Not only by enabling more informed target selection, but also by guiding other critical decisions such as selection of indications, safety outcomes, and trial population. But there is still too much nuance. Whether the real impact is two-fold, three-fold, or something else entirely ultimately depends less on counting genetic associations and more on a deeper understanding of each signal.
Great post and some valid points raised. However, I think several of the limitations you identify actually bias the RS estimate toward the null, not away from it.
Broad indication labels, for instance, make it harder to match genetic traits to drug indications at the 0.8 similarity threshold, so they are more likely to be classified as unsupported. Similarly, the lack of directionality of effect means that some T-I pairs classified as genetically supported actually have genetics arguing against the drug's mechanism. These pairs would be expected to fail, diluting the RS among the supported group. The true RS for directionally concordant genetic support is therefore likely even higher than 2.6x.
On L2G:
1) Minikel showed that RS increases with L2G share threshold (Figure 1c), which is what you would predict if the signal is real.
2) comparing L2G to nearest-gene at a single threshold is misleading because L2G is a continuous score and outperforms on precision at higher thresholds, which is what matters when a false positive costs millions.
3) imperfect gene mapping adds noise that, again, dilutes the RS estimate.
4) 23andMe could reproduce the results, and even showed a dose response between gene mapping confidence and clinical success, reaching up to 5x RS at the highest tier.
I think a lot of people have misunderstood what the paper claims. I don’t think Minikel never argue that genetic support should be a gate for drug development. They argue it is an enrichment signal, and a probabilistic tool for portfolio prioritization. Individual targets succeeding without genetic support does not invalidate that observation.
Whenever a paper's methodology is surprising, I get suspicious. There might be good reasons. But often, it suggests that the obvious and intuitive analysis didn't yield the results they were looking for.